
The rating said one thing, the test another
The thermal rating said 2.4 MW. The site test says 2.1. The surface area is right, the fluids are right, the fouling allowance was generous. Someone suggests the correlation was optimistic, and someone else quietly orders a larger unit for the next project.
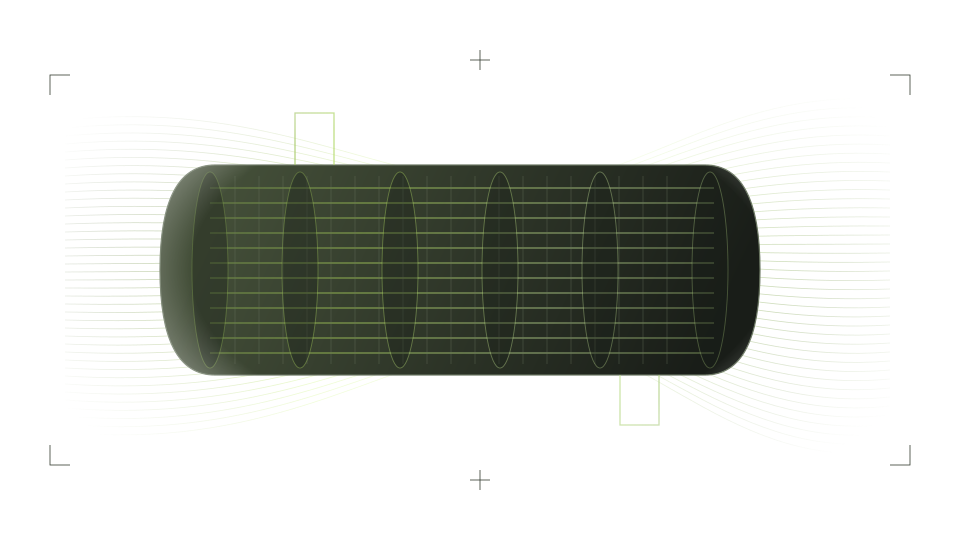
Before you blame the correlation, look at how the flow gets into the tubes. Rating methods assume every tube carries the same flow, and real headers do not deliver that. Heat exchanger flow maldistribution means some tubes or channels carry more flow than others, and it is a common reason a correctly sized unit underperforms.
Why does uneven flow cost duty?
Take two tubes side by side. One gets 130% of the average flow, the other 70%. The fast tube transfers more heat than average, but less than 30% more, because its fluid has less time to approach the wall temperature. The slow tube transfers less, and much of its length does very little. Together the pair delivers less than two average tubes would.
The losses do not stop at duty. A 2019 review by Tube Tech International and TU Dresden notes that the tubes at the low end of the velocity distribution are especially prone to fouling, and that some may clog and force an unplanned shutdown. Fouled tubes then get even less flow.
Where does it come from on the tube side?
A header is a small plenum fed by a nozzle, and the fluid arrives as a jet. The same review reports that flow is greater in the tubes near or in line with the intake pipe, and that connecting the intake to the side of the header, a common arrangement, produces a larger variation between tubes.
How bad this gets depends on a tug of war between two pressures: the dynamic pressure of the inlet jet, which pushes flow unevenly, and the pressure drop through the tubes, which resists it. A bundle with high resistance evens the flow out, because every tube needs most of the available pressure to pass anything at all.
The one-minute check
Compare the nozzle dynamic pressure with the tube pressure drop. As an example, water enters the header through a nozzle at 3 m/s.
If the pressure drop through the tubes is 6 kPa, the two are the same size. The jet has enough momentum to rearrange the flow, and you should expect clear maldistribution. If the tube pressure drop is 40 kPa, the jet is about a tenth of it, and the header matters much less.
Treat this as a screening rule. It tells you whether to worry and will not predict the distribution itself. Low-pressure-drop designs, gas-side headers, large bundles fed by small nozzles and short headers with abrupt changes in area are the usual suspects.
Where does it come from on the shell side?
The designer wants all the fluid to cross the tube bundle. Some of it leaks through the clearance between tubes and baffle holes. Some slips between the baffle edge and the shell. Some runs around the outside of the bundle without touching much surface at all. Rating methods account for these streams with correction factors, and those factors are averages.
Then there are the dead zones: the corners behind each baffle where fluid recirculates slowly and transfers little heat.
What does a CFD study show that a rating does not?
A rating program gives one number for the whole exchanger. A simulation gives the flow in each tube and each baffle compartment. On the tube side, a model of the header with the tubes attached returns a tube-by-tube flow distribution: which rows are starved, by how much, and how that changes with a design change. On the shell side, it shows how much fluid crosses the bundle, how much bypasses it, and where the recirculation zones sit.
Nobody meshes ten thousand tubes with resolved boundary layers. The usual approaches are a full header with each tube represented by its pressure loss, or a detailed section covering a few baffle spacings. Both are simplifications, and the report should say what they exclude. Fouling, tube plugging and as-built baffle clearances are assumptions unless you supply data.
What usually fixes it
- A perforated distributor plate in the header, which adds a little pressure drop exactly where you want resistance.
- An impingement plate or baffle to break up the jet.
- A larger or longer header, or a conical inlet, so the jet has room to spread.
- A different nozzle position, or two smaller nozzles.
- Sealing strips on the shell side to block the bypass around the bundle.
A simulation lets you compare these before anything is cut. A distributor plate that fixes the distribution at design flow may do little at half load, and you would rather learn that on a screen.
When is a study worth it?
If the one-minute check shows the inlet dynamic pressure is a small fraction of the bundle pressure drop, and the unit is a standard design, probably not. If the two are comparable, if the exchanger is large or expensive, if it has already missed its duty, or if the geometry is unusual, then finding out where the flow goes costs far less than a second unit.
Sources & further reading
Related service
Heat transfer
Identify the thermal bottleneck and compare design changes.
Explore services